kubernetes控制面指标梳理
kubernetes组件指标梳理
本文梳理指标对应的的kubernetes版本为1.23.1, etcd版本为3.5.1
kube-apiserver 指标
kuber-apiserver暴露了148个指标,梳理后比较重要的指标如下。
# HELP apiserver_request_duration_seconds [STABLE] Response latency distribution in seconds for each verb, dry run value, group, version, resource, subresource, scope and component.
# TYPE apiserver_request_duration_seconds histogram
apiserver响应的时间分布,按照url 和 verb 分类
一般按照instance和verb+时间 汇聚

# HELP apiserver_request_total [STABLE] Counter of apiserver requests broken out for each verb, dry run value, group, version, resource, scope, component, and HTTP response code.
# TYPE apiserver_request_total counter
apiserver的请求总数,按照verb、 version、 group、resource、scope、component、 http返回码分类统计

# HELP apiserver_current_inflight_requests [STABLE] Maximal number of currently used inflight request limit of this apiserver per request kind in last second.
# TYPE apiserver_current_inflight_requests gauge
当前最大请求数(利用channel大小限流), 按mutating(非get list watch的请求) 和 readOnly (get list watch)分别限制
超过max-requests-inflight(默认值400)  和 max-mutating-requests-inflight(默认200) 的请求会被限流
apiserver变更时要注意观察,也是反馈集群容量的一个重要指标

# HELP apiserver_response_sizes [STABLE] Response size distribution in bytes for each group, version, verb, resource, subresource, scope and component.
# TYPE apiserver_response_sizes histogram
apiserver 响应大小,单位byte, 按照verb、 version、 group、resource、scope、component分类统计

# HELP watch_cache_capacity [ALPHA] Total capacity of watch cache broken by resource type.
# TYPE watch_cache_capacity gauge
按照资源类型统计的watch缓存大小

# HELP process_cpu_seconds_total Total user and system CPU time spent in seconds.
# TYPE process_cpu_seconds_total counter
每秒钟用户态和系统态cpu消耗时间, 计算apiserver进程的cpu的使用率

# HELP process_resident_memory_bytes Resident memory size in bytes.
# TYPE process_resident_memory_bytes gauge
apiserver的内存使用量(单位:Byte)

# HELP workqueue_adds_total [ALPHA] Total number of adds handled by workqueue
# TYPE workqueue_adds_total counter
apiserver中包含的controller的工作队列,已处理的任务总数

# HELP workqueue_depth [ALPHA] Current depth of workqueue
# TYPE workqueue_depth gauge
apiserver中包含的controller的工作队列深度,表示当前队列中要处理的任务的数量,数值越小越好
例如APIServiceRegistrationController admission_quota_controller
kube-apiserver对应的指标大盘在apiserver-dash.json
kube-controller-manager 指标
kube-controller-manager暴露了61个指标,梳理后比较重要的指标如下。
# HELP rest_client_request_duration_seconds [ALPHA] Request latency in seconds. Broken down by verb and URL.
# TYPE rest_client_request_duration_seconds histogram
请求apiserver的耗时分布,按照url+verb统计

# HELP cronjob_controller_cronjob_job_creation_skew_duration_seconds [ALPHA] Time between when a cronjob is scheduled to be run, and when the corresponding job is created
# TYPE cronjob_controller_cronjob_job_creation_skew_duration_seconds histogram
cronjob 创建到运行的时间分布

# HELP leader_election_master_status [ALPHA] Gauge of if the reporting system is master of the relevant lease, 0 indicates backup, 1 indicates master. 'name' is the string used to identify the lease. Please make sure to group by name.
# TYPE leader_election_master_status gauge
控制器的选举状态,0表示backup, 1表示master

# HELP node_collector_zone_health [ALPHA] Gauge measuring percentage of healthy nodes per zone.
# TYPE node_collector_zone_health gauge
每个zone的健康node占比

# HELP node_collector_zone_size [ALPHA] Gauge measuring number of registered Nodes per zones.
# TYPE node_collector_zone_size gauge
每个zone的node数

# HELP process_cpu_seconds_total Total user and system CPU time spent in seconds.
# TYPE process_cpu_seconds_total counter
cpu使用量(也可以理解为cpu使用率)

# HELP process_open_fds Number of open file descriptors.
# TYPE process_open_fds gauge
控制器打开的fd数

# HELP pv_collector_bound_pv_count [ALPHA] Gauge measuring number of persistent volume currently bound
# TYPE pv_collector_bound_pv_count gauge
当前绑定的pv数量

# HELP pv_collector_unbound_pvc_count [ALPHA] Gauge measuring number of persistent volume claim currently unbound
# TYPE pv_collector_unbound_pvc_count gauge
当前没有绑定的pvc数量


# HELP pv_collector_bound_pvc_count [ALPHA] Gauge measuring number of persistent volume claim currently bound
# TYPE pv_collector_bound_pvc_count gauge
当前绑定的pvc数量

# HELP pv_collector_total_pv_count [ALPHA] Gauge measuring total number of persistent volumes
# TYPE pv_collector_total_pv_count gauge
pv总数量


# HELP workqueue_adds_total [ALPHA] Total number of adds handled by workqueue
# TYPE workqueue_adds_total counter
各个controller已接受的任务总数
与apiserver的workqueue_adds_total指标类似

# HELP workqueue_depth [ALPHA] Current depth of workqueue
# TYPE workqueue_depth gauge
各个controller队列深度,表示一个controller中的任务的数量
与apiserver的workqueue_depth类似,这个是指各个controller中队列的深度,数值越小越好

# HELP workqueue_queue_duration_seconds [ALPHA] How long in seconds an item stays in workqueue before being requested.
# TYPE workqueue_queue_duration_seconds histogram
任务在队列中的等待耗时,按照控制器分别统计

# HELP workqueue_work_duration_seconds [ALPHA] How long in seconds processing an item from workqueue takes.
# TYPE workqueue_work_duration_seconds histogram
任务出队到被处理完成的时间,按照控制分别统计

# HELP workqueue_retries_total [ALPHA] Total number of retries handled by workqueue
# TYPE workqueue_retries_total counter
任务进入队列重试的次数

# HELP workqueue_longest_running_processor_seconds [ALPHA] How many seconds has the longest running processor for workqueue been running.
# TYPE workqueue_longest_running_processor_seconds gauge
正在处理的任务中,最长耗时任务的处理时间

# HELP endpoint_slice_controller_syncs [ALPHA] Number of EndpointSlice syncs
# TYPE endpoint_slice_controller_syncs counter
endpoint_slice 同步的数量 (1.20以上)

# HELP get_token_fail_count [ALPHA] Counter of failed Token() requests to the alternate token source
# TYPE get_token_fail_count counter
获取token失败的次数

# HELP go_memstats_gc_cpu_fraction The fraction of this program's available CPU time used by the GC since the program started.
# TYPE go_memstats_gc_cpu_fraction gauge
controller gc的cpu使用率
其中workqueue_queue_duration_seconds与workqueue_work_duration_seconds比较容易迷惑。 workqueue_work_duration_seconds统计逻辑见截图。


简单说 ,workqueue_queue_duration_seconds是任务从队列add到从队列get的耗时,即进队到出队的耗时;而workqueue_work_duration_seconds是从队列get到任务done的耗时,即出队到任务完成的耗时。
kube-controller-manager对应的大盘在cm-dash.json
kube-scheduler指标
kube-scheduler暴露了 53个指标 梳理后比较重要的指标如下。
# HELP rest_client_request_duration_seconds [ALPHA] Request latency in seconds. Broken down by verb and URL.
# TYPE rest_client_request_duration_seconds histogram
请求apiserver的延迟分布

# HELP rest_client_requests_total [ALPHA] Number of HTTP requests, partitioned by status code, method, and host.
# TYPE rest_client_requests_total counter
请求apiserver的总数 ,按照host code method 统计

# HELP leader_election_master_status [ALPHA] Gauge of if the reporting system is master of the relevant lease, 0 indicates backup, 1 indicates master. 'name' is the string used to identify the lease. Please make sure to group by name.
# TYPE leader_election_master_status gauge
调度器的选举状态,0表示backup, 1表示master

# HELP scheduler_queue_incoming_pods_total [STABLE] Number of pods added to scheduling queues by event and queue type.
# TYPE scheduler_queue_incoming_pods_total counter
进入调度队列的pod数

# HELP scheduler_preemption_attempts_total [STABLE] Total preemption attempts in the cluster till now
# TYPE scheduler_preemption_attempts_total counter
调度器驱逐容器的次数

# HELP scheduler_scheduler_cache_size [ALPHA] Number of nodes, pods, and assumed (bound) pods in the scheduler cache.
# TYPE scheduler_scheduler_cache_size gauge
调度器cache中node pod和绑定pod的数目

# HELP scheduler_pending_pods [STABLE] Number of pending pods, by the queue type. 'active' means number of pods in activeQ; 'backoff' means number of pods in backoffQ; 'unschedulable' means number of pods in unschedulableQ.
# TYPE scheduler_pending_pods gauge
调度pending的pod数量,按照queue type分别统计

# HELP scheduler_plugin_execution_duration_seconds [ALPHA] Duration for running a plugin at a specific extension point.
# TYPE scheduler_plugin_execution_duration_seconds histogram
调度插件在每个扩展点的执行时间,按照extension_point+plugin+status 分别统计

# HELP scheduler_e2e_scheduling_duration_seconds [ALPHA] (Deprecated since 1.23.0) E2e scheduling latency in seconds (scheduling algorithm + binding). This metric is replaced by scheduling_attempt_duration_seconds.
# TYPE scheduler_e2e_scheduling_duration_seconds histogram
调度延迟分布,1.23.0 以后会被scheduling_attempt_duration_seconds替代

# HELP scheduler_framework_extension_point_duration_seconds [STABLE] Latency for running all plugins of a specific extension point.
# TYPE scheduler_framework_extension_point_duration_seconds histogram
调度框架的扩展点延迟分布,按extension_point(扩展点Bind Filter Permit PreBind/PostBind PreFilter/PostFilter Reseve)
+profile(调度器)+ status(调度成功) 统计

# HELP scheduler_pod_scheduling_attempts [STABLE] Number of attempts to successfully schedule a pod.
# TYPE scheduler_pod_scheduling_attempts histogram
pod调度成功前,调度重试的次数分布

# HELP scheduler_schedule_attempts_total [STABLE] Number of attempts to schedule pods, by the result. 'unschedulable' means a pod could not be scheduled, while 'error' means an internal scheduler problem.
# TYPE scheduler_schedule_attempts_total counter
按照调度结果统计的调度重试次数。 "unschedulable" 表示无法调度,"error"表示调度器内部错误

# HELP scheduler_scheduler_goroutines [ALPHA] Number of running goroutines split by the work they do such as binding.
# TYPE scheduler_scheduler_goroutines gauge
按照功能(binding filter之类)统计的goroutine数量

# HELP scheduler_scheduling_algorithm_duration_seconds [ALPHA] Scheduling algorithm latency in seconds
# TYPE scheduler_scheduling_algorithm_duration_seconds histogram
调度算法的耗时分布

# HELP scheduler_scheduling_attempt_duration_seconds [STABLE] Scheduling attempt latency in seconds (scheduling algorithm + binding)
# TYPE scheduler_scheduling_attempt_duration_seconds histogram
调度算法+binding的耗时分布

# HELP scheduler_scheduler_goroutines [ALPHA] Number of running goroutines split by the work they do such as binding.
# TYPE scheduler_scheduler_goroutines gauge
调度器的goroutines数目
对应的大盘在scheduler-dash.json
etcd指标
etcd暴露了122个指标,需要关注的指标有
# HELP etcd_server_is_leader Whether or not this member is a leader. 1 if is, 0 otherwise.
# TYPE etcd_server_is_leader gauge
etcd leader 表示 ,1 leader 0 learner
# HELP etcd_server_health_success The total number of successful health checks
# TYPE etcd_server_health_success counter
etcd server 健康检查成功次数
# HELP etcd_server_health_failures The total number of failed health checks
# TYPE etcd_server_health_failures counter
etcd server 健康检查失败次数
# HELP etcd_disk_defrag_inflight Whether or not defrag is active on the member. 1 means active, 0 means not.
# TYPE etcd_disk_defrag_inflight gauge
是否启动数据压缩,1表示压缩,0表示没有启动压缩
# HELP etcd_server_snapshot_apply_in_progress_total 1 if the server is applying the incoming snapshot. 0 if none.
# TYPE etcd_server_snapshot_apply_in_progress_total gauge
是否再快照中,1 快照中,0 没有
# HELP etcd_server_leader_changes_seen_total The number of leader changes seen.
# TYPE etcd_server_leader_changes_seen_total counter
# HELP grpc_server_handled_total Total number of RPCs completed on the server, regardless of success or failure.
# TYPE grpc_server_handled_total counter
集群leader切换的次数
# HELP etcd_disk_wal_fsync_duration_seconds The latency distributions of fsync called by WAL.
# TYPE etcd_disk_wal_fsync_duration_seconds histogram
etcd wal同步耗时
# HELP etcd_server_proposals_failed_total The total number of failed proposals seen.
# TYPE etcd_server_proposals_failed_total counter
etcd proposal(提议)失败总次数(proposal就是完成raft协议的一次请求)
# HELP etcd_server_proposals_pending The current number of pending proposals to commit.
# TYPE etcd_server_proposals_pending gauge
etcd proposal(提议)pending总次数(proposal就是完成raft协议的一次请求)
# HELP etcd_server_read_indexes_failed_total The total number of failed read indexes seen.
# TYPE etcd_server_read_indexes_failed_total counter
读取索引失败的次数统计(v3索引为所有key都建了索引,索引是为了加快range操作)
# HELP etcd_server_slow_read_indexes_total The total number of pending read indexes not in sync with leader's or timed out read index requests.
# TYPE etcd_server_slow_read_indexes_total counter
读取到过期索引或者读取超时的次数
# HELP etcd_server_quota_backend_bytes Current backend storage quota size in bytes.
# TYPE etcd_server_quota_backend_bytes gauge
当前后端的存储quota(db大小的上限)
通过参数quota-backend-bytes调整大小,默认2G,官方建议不超过8G
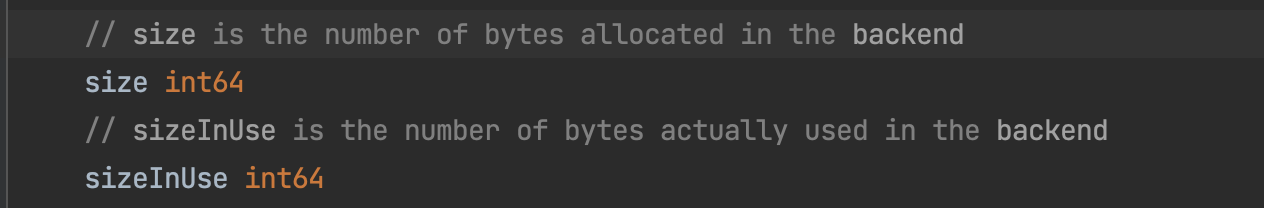
# HELP etcd_mvcc_db_total_size_in_bytes Total size of the underlying database physically allocated in bytes.
# TYPE etcd_mvcc_db_total_size_in_bytes gauge
etcd 分配的db大小(使用量大小+空闲大小)
# HELP etcd_mvcc_db_total_size_in_use_in_bytes Total size of the underlying database logically in use in bytes.
# TYPE etcd_mvcc_db_total_size_in_use_in_bytes gauge
etcd db的使用量大小
# HELP etcd_mvcc_range_total Total number of ranges seen by this member.
# TYPE etcd_mvcc_range_total counter
etcd执行range的数量
# HELP etcd_mvcc_put_total Total number of puts seen by this member.
# TYPE etcd_mvcc_put_total counter
etcd执行put的数量
# HELP etcd_mvcc_txn_total Total number of txns seen by this member.
# TYPE etcd_mvcc_txn_total counter
etcd实例执行事务的数量
# HELP etcd_mvcc_delete_total Total number of deletes seen by this member.
# TYPE etcd_mvcc_delete_total counter
etcd实例执行delete操作的数量
# HELP process_cpu_seconds_total Total user and system CPU time spent in seconds.
# TYPE process_cpu_seconds_total counter
etcd cpu使用量
# HELP process_resident_memory_bytes Resident memory size in bytes.
# TYPE process_resident_memory_bytes gauge
etcd 内存使用量
# HELP process_open_fds Number of open file descriptors.
# TYPE process_open_fds gauge
etcd 打开的fd数目
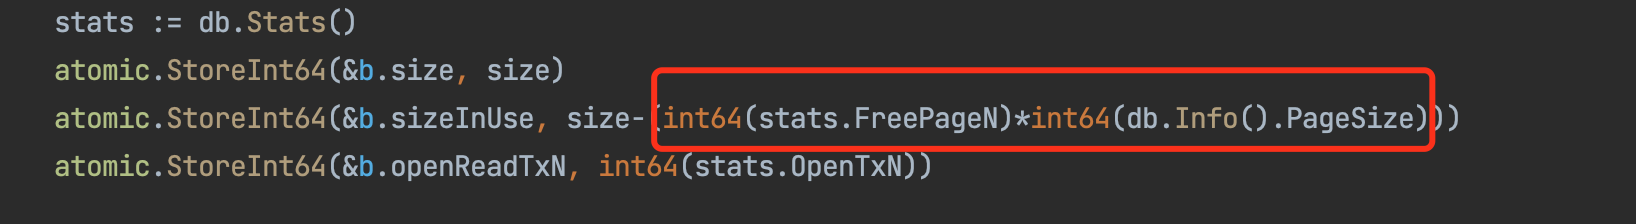
其中 etcd_mvcc_db_total_size_in_use_in_bytes 和 etcd_mvcc_db_total_size_in_use_in_bytes分别对应源码中backend的size和sizeInUse,即DB分配的大小和当前使用的大小。
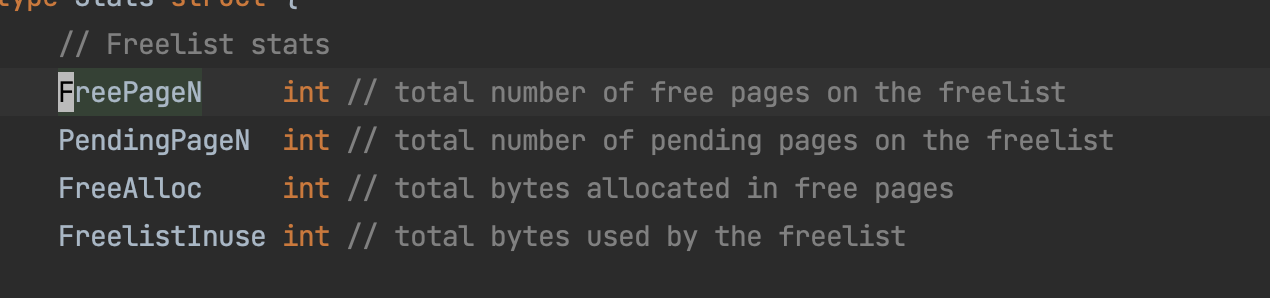
 分配大小和使用大小之差就是没有使用的FreePageN*PageSize
关于控制面组件的采集方式,上篇文章也有提到,通过service方式采集也整理了一个yaml文件供参考deployment.yaml