记录 Categraf http_response 插件报错 TLS handshake failure 的排查过程。分析 IPv4/IPv6 入口 TLS 配置差异、Go 1.24 默认加密套件变更导致的握手失败,提供 tls_cipher_suites 配置方案解决兼容性问题。
备忘
last update:
自动化还是自动化
周五下午跟客户开完例会,稍微梳理了一下这周的需求,发现本周开源版和企业版都发布了很多版本。这里面包含我一直拖着没做的自动化环节。模块发布流程:
- 打tag -> 触发github action -> goreleaser -> github scm / docker hub;
- 镜像也是需要上传到国内公有云镜像市场的,方便交付同事交付;
- 二进制包需要上传到公有云存储,方便交付客户和国内社区用户下载。
这里第一步完全是自动化的,第二步之前也是goreleaser来做得,但是呢github推镜像到国内的云镜像市场,那个时间瞬间就是小时起步了。通过测试发现办公网推国内的镜像市场非常快, 那就从免费的github runner 迁移到办公网内的台式机上。这一步其实需要很扎实的网络来保证跟github的通信, 不过这个改造后步骤1的时间降到了8分钟, 那这些工作就很值了。为了避免直接物理机上做一些骚操作,搞了一个runner的容器镜像。 如何构建镜像见https://github.com/kongfei605/github-runner
一 背景
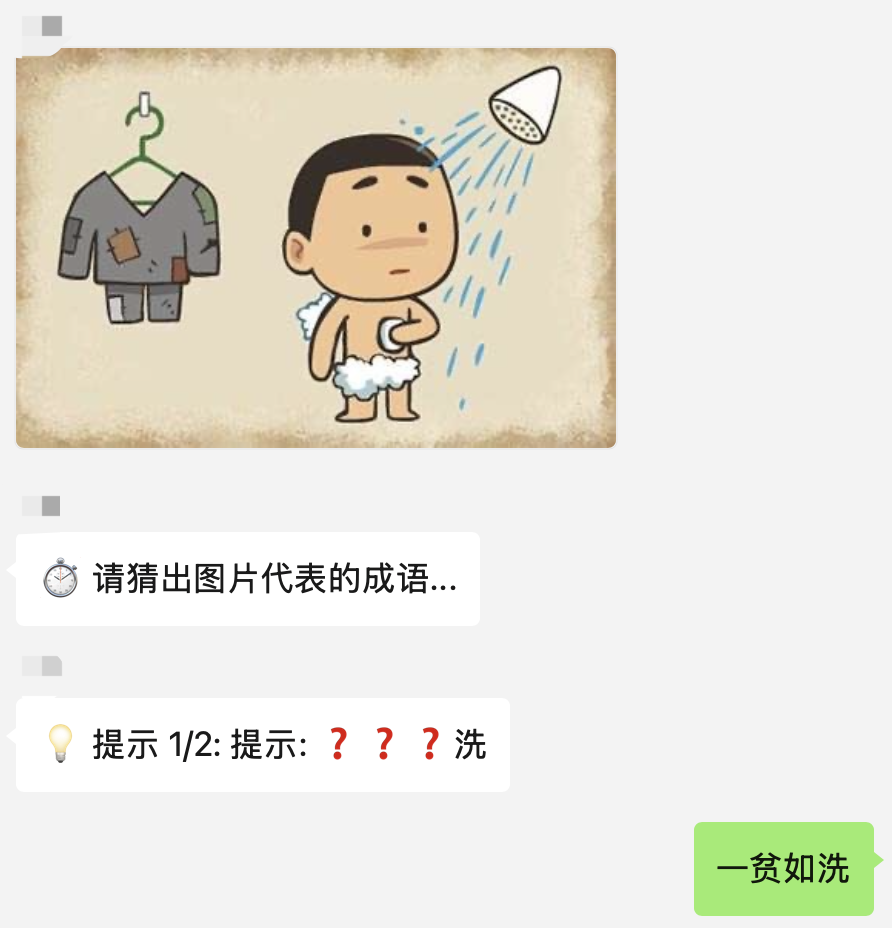
偶尔看到其他机器人有很多插件,有个看图猜成语的很有意思。连续一段时间都在处理客户的问题,刚好周五晚上,顺道做个适合当前框架的插件。
看图猜成语是一个适合群聊的游戏,它是通过调用api实现的。这个api会返回一个图片链接和对应的成语, 再没有回答对正确答案之前,会逐渐做出提示。