一些采坑或者日常答疑问题的记录,这些问题有时不是很直观,有时排查链路比较长,为了避免反复排查同类问题,简单记录一下。
1.cadvisor如何统计fd数目
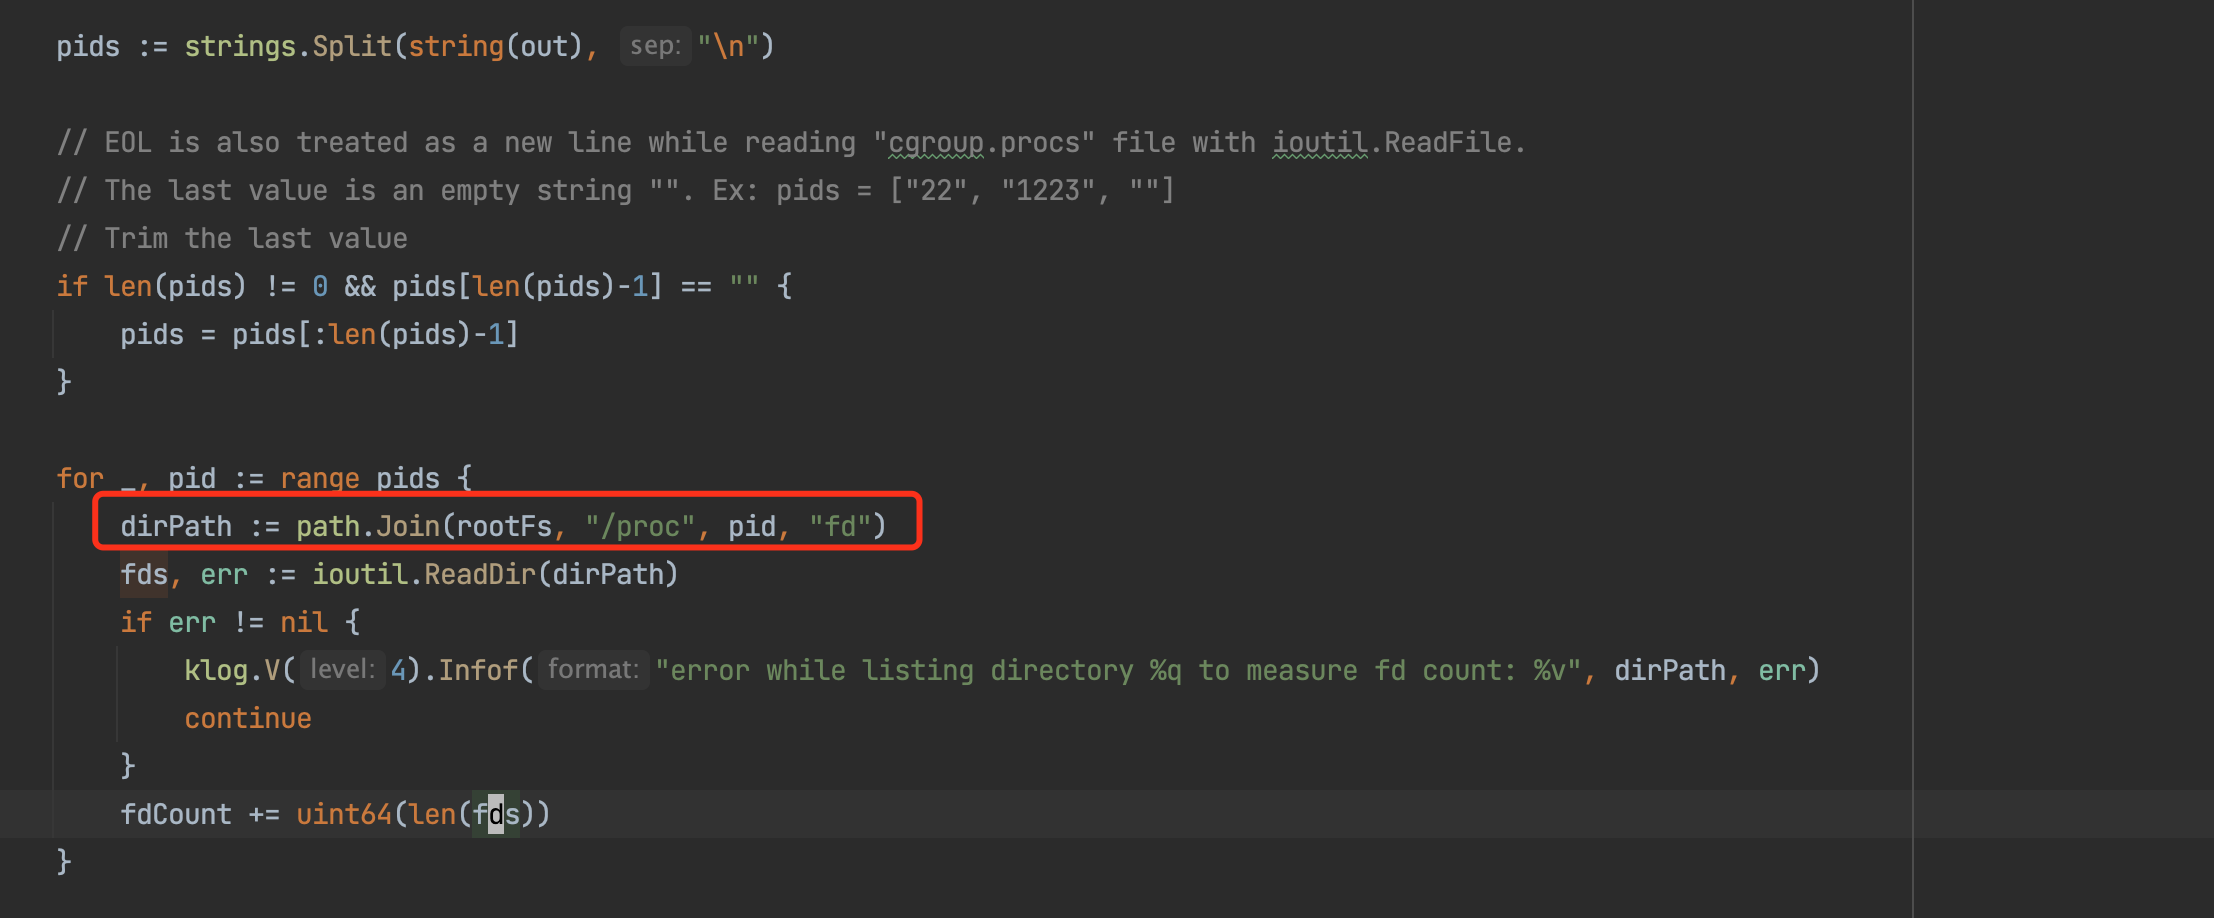
cadvisor获取容器cgroup路径下的cgroup.procs 拿到容器内所有进程pid,然后统计所有pid对应/proc/$pid/fd目录数
一些采坑或者日常答疑问题的记录,这些问题有时不是很直观,有时排查链路比较长,为了避免反复排查同类问题,简单记录一下。
cadvisor获取容器cgroup路径下的cgroup.procs 拿到容器内所有进程pid,然后统计所有pid对应/proc/$pid/fd目录数
role和serviceaccount均以talk-test为前缀 , namespace为flashtalk
---
apiVersion: rbac.authorization.k8s.io/v1
kind: ClusterRole
metadata:
  annotations: {}
  labels:
    app: n9e
    component: categraf
  name: talk-test-role
rules:
  - apiGroups: [""]
    resources:
      - nodes
      - nodes/metrics
      - services
      - endpoints
      - pods
    verbs: ["get", "list", "watch"]
  - apiGroups:
      - extensions
      - networking.k8s.io
    resources:
      - ingresses
    verbs: ["get", "list", "watch"]
  - nonResourceURLs: ["/metrics", "/metrics/cadvisor"]
    verbs: ["get"]
---
apiVersion: v1
kind: ServiceAccount
metadata:
  annotations: {}
  labels:
    app: n9e
    component: categraf
  name: talk-test-serviceaccount
---
apiVersion: rbac.authorization.k8s.io/v1
kind: ClusterRoleBinding
metadata:
  annotations: {}
  labels:
    app: n9e
    component: categraf
  name: talk-test-rolebinding
roleRef:
  apiGroup: rbac.authorization.k8s.io
  kind: ClusterRole
  name: talk-test-role
subjects:
- kind: ServiceAccount
  name: talk-test-serviceaccount
  namespace: flashtalk
这一篇我们梳理node相关的指标,话不多说,先上指标。
1.kubelet自身指标梳理
# HELP go_gc_duration_seconds A summary of the pause duration of garbage collection cycles.
# TYPE go_gc_duration_seconds summary
gc的时间统计(summary指标)

# HELP go_goroutines Number of goroutines that currently exist.
# TYPE go_goroutines gauge
goroutine 数量

# HELP go_threads Number of OS threads created.
# TYPE go_threads gauge
os的线程数量


# HELP kubelet_cgroup_manager_duration_seconds [ALPHA] Duration in seconds for cgroup manager operations. Broken down by method.
# TYPE kubelet_cgroup_manager_duration_seconds histogram
操作cgroup的时长分布,按照操作类型统计

# HELP kubelet_containers_per_pod_count [ALPHA] The number of containers per pod.
# TYPE kubelet_containers_per_pod_count histogram
pod中container数量的统计(spec.containers的数量)


# HELP kubelet_docker_operations_duration_seconds [ALPHA] Latency in seconds of Docker operations. Broken down by operation type.
# TYPE kubelet_docker_operations_duration_seconds histogram
操作docker的时长分布,按照操作类型统计

# HELP kubelet_docker_operations_errors_total [ALPHA] Cumulative number of Docker operation errors by operation type.
# TYPE kubelet_docker_operations_errors_total counter
操作docker的错误累计次数,按照操作类型统计

# HELP kubelet_docker_operations_timeout_total [ALPHA] Cumulative number of Docker operation timeout by operation type.
# TYPE kubelet_docker_operations_timeout_total counter
操作docker的超时统计,按照操作类型统计

# HELP kubelet_docker_operations_total [ALPHA] Cumulative number of Docker operations by operation type.
# TYPE kubelet_docker_operations_total counter
操作docker的累计次数,按照操作类型统计

# HELP kubelet_eviction_stats_age_seconds [ALPHA] Time between when stats are collected, and when pod is evicted based on those stats by eviction signal
# TYPE kubelet_eviction_stats_age_seconds histogram
驱逐操作的时间分布,按照驱逐信号(原因)分类统计

# HELP kubelet_evictions [ALPHA] Cumulative number of pod evictions by eviction signal
# TYPE kubelet_evictions counter
驱逐次数统计,按照驱逐信号(原因)统计

# HELP kubelet_http_inflight_requests [ALPHA] Number of the inflight http requests
# TYPE kubelet_http_inflight_requests gauge
请求kubelet的inflight请求数,按照method path server_type统计
注意与每秒的request数区别开

# HELP kubelet_http_requests_duration_seconds [ALPHA] Duration in seconds to serve http requests
# TYPE kubelet_http_requests_duration_seconds histogram
请求kubelet的请求时间统计,按照method path server_type统计

# HELP kubelet_http_requests_total [ALPHA] Number of the http requests received since the server started
# TYPE kubelet_http_requests_total counter
请求kubelet的请求数统计,按照method path server_type统计

# HELP kubelet_managed_ephemeral_containers [ALPHA] Current number of ephemeral containers in pods managed by this kubelet. Ephemeral containers will be ignored if disabled by the EphemeralContainers feature gate, and this number will be 0.
# TYPE kubelet_managed_ephemeral_containers gauge
当前kubelet管理的临时容器数量

# HELP kubelet_network_plugin_operations_duration_seconds [ALPHA] Latency in seconds of network plugin operations. Broken down by operation type.
# TYPE kubelet_network_plugin_operations_duration_seconds histogram
网络插件的操作耗时分布 ,按照操作类型(operation_type)统计
如果 --feature-gates=EphemeralContainers=false,否则一直为0

# HELP kubelet_network_plugin_operations_errors_total [ALPHA] Cumulative number of network plugin operation errors by operation type.
# TYPE kubelet_network_plugin_operations_errors_total counter
网络插件累计操作错误数统计,按照操作类型(operation_type)统计

# HELP kubelet_network_plugin_operations_total [ALPHA] Cumulative number of network plugin operations by operation type.
# TYPE kubelet_network_plugin_operations_total counter
网络插件累计操作数统计,按照操作类型(operation_type)统计

# HELP kubelet_node_name [ALPHA] The node's name. The count is always 1.
# TYPE kubelet_node_name gauge
node name

# HELP kubelet_pleg_discard_events [ALPHA] The number of discard events in PLEG.
# TYPE kubelet_pleg_discard_events counter
PLEG(pod lifecycle event generator) 丢弃的event数统计

# HELP kubelet_pleg_last_seen_seconds [ALPHA] Timestamp in seconds when PLEG was last seen active.
# TYPE kubelet_pleg_last_seen_seconds gauge
PLEG上次活跃的时间戳

# HELP kubelet_pleg_relist_duration_seconds [ALPHA] Duration in seconds for relisting pods in PLEG.
# TYPE kubelet_pleg_relist_duration_seconds histogram
PLEG relist pod时间分布

# HELP kubelet_pleg_relist_interval_seconds [ALPHA] Interval in seconds between relisting in PLEG.
# TYPE kubelet_pleg_relist_interval_seconds histogram
PLEG relist 间隔时间分布

# HELP kubelet_pod_start_duration_seconds [ALPHA] Duration in seconds for a single pod to go from pending to running.
# TYPE kubelet_pod_start_duration_seconds histogram
pod启动时间(从pending到running)分布
kubelet watch到pod时到pod中contianer都running后
(watch各种source channel的pod变更)

# HELP kubelet_pod_worker_duration_seconds [ALPHA] Duration in seconds to sync a single pod. Broken down by operation type: create, update, or sync
# TYPE kubelet_pod_worker_duration_seconds histogram
pod状态变化的时间分布, 按照操作类型(create update sync)统计
worker就是kubelet中处理一个pod的逻辑工作单位

# HELP kubelet_pod_worker_start_duration_seconds [ALPHA] Duration in seconds from seeing a pod to starting a worker.
# TYPE kubelet_pod_worker_start_duration_seconds histogram
kubelet watch到pod到worker启动的时间分布

# HELP kubelet_run_podsandbox_duration_seconds [ALPHA] Duration in seconds of the run_podsandbox operations. Broken down by RuntimeClass.Handler.
# TYPE kubelet_run_podsandbox_duration_seconds histogram
启动sandbox的时间分布

# HELP kubelet_run_podsandbox_errors_total [ALPHA] Cumulative number of the run_podsandbox operation errors by RuntimeClass.Handler.
# TYPE kubelet_run_podsandbox_errors_total counter
启动sanbox出现error的总数

# HELP kubelet_running_containers [ALPHA] Number of containers currently running
# TYPE kubelet_running_containers gauge
当前containers运行状态的统计
按照container状态统计,created running exited

# HELP kubelet_running_pods [ALPHA] Number of pods that have a running pod sandbox
# TYPE kubelet_running_pods gauge
当前处于running状态pod数量

# HELP kubelet_runtime_operations_duration_seconds [ALPHA] Duration in seconds of runtime operations. Broken down by operation type.
# TYPE kubelet_runtime_operations_duration_seconds histogram
容器运行时的操作耗时
(container在create list exec remove stop等的耗时)

# HELP kubelet_runtime_operations_errors_total [ALPHA] Cumulative number of runtime operation errors by operation type.
# TYPE kubelet_runtime_operations_errors_total counter
容器运行时的操作错误数统计(按操作类型统计)

# HELP kubelet_runtime_operations_total [ALPHA] Cumulative number of runtime operations by operation type.
# TYPE kubelet_runtime_operations_total counter
容器运行时的操作总数统计(按操作类型统计)

# HELP kubelet_started_containers_errors_total [ALPHA] Cumulative number of errors when starting containers
# TYPE kubelet_started_containers_errors_total counter
kubelet启动容器错误总数统计(按code和container_type统计)
code包括ErrImagePull ErrImageInspect ErrImagePull ErrRegistryUnavailable ErrInvalidImageName等
container_type一般为"container" "podsandbox"

# HELP kubelet_started_containers_total [ALPHA] Cumulative number of containers started
# TYPE kubelet_started_containers_total counter
kubelet启动容器总数

# HELP kubelet_started_pods_errors_total [ALPHA] Cumulative number of errors when starting pods
# TYPE kubelet_started_pods_errors_total counter
kubelet启动pod遇到的错误总数(只有创建sandbox遇到错误才会统计)

# HELP kubelet_started_pods_total [ALPHA] Cumulative number of pods started
# TYPE kubelet_started_pods_total counter
kubelet启动的pod总数

# HELP process_cpu_seconds_total Total user and system CPU time spent in seconds.
# TYPE process_cpu_seconds_total counter
统计cpu使用率

# HELP process_max_fds Maximum number of open file descriptors.
# TYPE process_max_fds gauge
允许进程打开的最大fd数

# HELP process_open_fds Number of open file descriptors.
# TYPE process_open_fds gauge
当前打开的fd数量

# HELP process_resident_memory_bytes Resident memory size in bytes.
# TYPE process_resident_memory_bytes gauge
进程驻留内存大小

# HELP process_start_time_seconds Start time of the process since unix epoch in seconds.
# TYPE process_start_time_seconds gauge
进程启动时间

# HELP rest_client_request_duration_seconds [ALPHA] Request latency in seconds. Broken down by verb and URL.
# TYPE rest_client_request_duration_seconds histogram
请求apiserver的耗时统计(按照url和请求类型统计verb)

# HELP rest_client_requests_total [ALPHA] Number of HTTP requests, partitioned by status code, method, and host.
# TYPE rest_client_requests_total counter
请求apiserver的总次数(按照返回码code和请求类型method统计)

# HELP storage_operation_duration_seconds [ALPHA] Storage operation duration
# TYPE storage_operation_duration_seconds histogram
存储操作耗时(按照存储plugin(configmap emptydir hostpath 等 )和operation_name分类统计)
# HELP volume_manager_total_volumes [ALPHA] Number of volumes in Volume Manager
# TYPE volume_manager_total_volumes gauge
本机挂载的volume数量统计(按照plugin_name和state统计
plugin_name包括"host-path" "empty-dir" "configmap" "projected")
state(desired_state_of_world期状态/actual_state_of_world实际状态)